
Training intensities are a recurring source of debate. Someone swears by spending 80% of their time in Zone 2. Someone else says the Norwegian method is the real secret. Another camp insists HIIT delivers the fastest gains. Every claim has data behind it. Every approach has produced good results.
The question isn’t which method is correct — it’s how any of them actually make you stronger.
Training Is Signaling
We covered LT1, LT2, and how the three-zone model divides training intensity in LT1 / LT2 and the Three-Zone Model; Three Heart Rate Zone Methods covers how to anchor those zone boundaries using heart rate. This goes one layer deeper — not the zones themselves, but what each zone triggers inside your body.
Training is fundamentally a signaling process. Apply enough stress, the body detects it, fires off a cascade of molecular responses, and adapts once the stress is gone. Different intensities send different signals and trigger different adaptations. The gene expression pattern activated in muscle cells after a Zone 2 run looks different from what happens after a HIIT session — not as a metaphor, but literally.
Exercise scientist Andrew Coggan systematized this in Training and Racing with a Power Meter (co-authored with Hunter Allen, VeloPress, 2006; third edition 2019): 7 training intensity zones, each with a distinct profile of how strongly it stimulates each physiological adaptation.
Six Physiological Adaptations
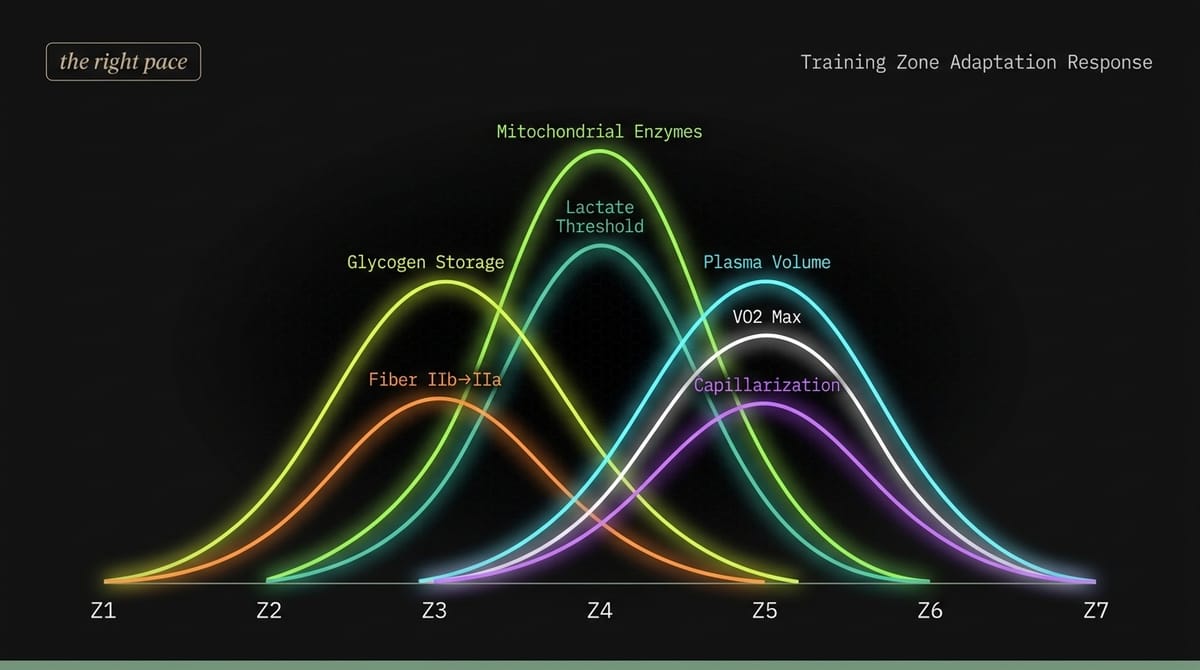
Coggan mapped adaptations across several dimensions: mitochondrial enzyme activity, lactate threshold, muscle glycogen storage, plasma volume and cardiac output, muscle capillary density, and fiber type transitions. Each can be improved independently — and each has an intensity zone where it responds most strongly.
| Physiological Adaptation | Z1 | Z2 | Z3 | Z4 | Z5 | Z6 | Z7 |
|---|---|---|---|---|---|---|---|
| Plasma Volume ↑ | — | ● | ●● | ●●● | ●●●● | ● | — |
| Muscle Mitochondrial Enzyme Activity ↑ | — | ●● | ●●● | ●●●● | ●● | ● | — |
| Lactate Threshold ↑ | — | ●● | ●●● | ●●●● | ●● | ● | — |
| Muscle Glycogen Storage ↑ | — | ●● | ●●●● | ●●● | ●● | ● | — |
| Slow-Twitch Fiber Hypertrophy | — | ● | ●● | ●● | ●●● | ● | — |
| Muscle Capillary Density ↑ | — | ● | ●● | ●● | ●●● | ● | — |
| Fiber Type Conversion (IIb → IIa) | — | ●● | ●●● | ●● | ●● | ● | — |
| Stroke Volume / Max Cardiac Output ↑ | — | ● | ●● | ●●● | ●●●● | ● | — |
| VO2max ↑ | — | ● | ●● | ●●● | ●●●● | ● | — |
| High-Energy Phosphate Stores (ATP/PCr) ↑ | — | — | — | — | — | ● | ●● |
| Anaerobic Capacity ↑ (Lactate Tolerance) | — | — | — | — | ● | ●●● | ● |
| Fast-Twitch Fiber Hypertrophy | — | — | — | — | — | ● | ●● |
| Neuromuscular Power ↑ | — | — | — | — | — | ● | ●●● |
●●●● = Peak stimulus ●●● = Strong ●● = Moderate ● = Minor — = No significant effect
Two things stand out from this table. First, Zone 1 (active recovery) produces almost no adaptations at all — its function is recovery from the previous session, not building new capacity. Second, and more surprising: Zone 4 (threshold) scores highest for both mitochondrial enzyme activity and lactate threshold — not Zone 2, and not Zone 5.
Mitochondria: The Cell’s Power Plant
Mitochondria are the core of aerobic energy metabolism, converting glucose and fatty acids into ATP. With training, they multiply, grow larger, and increase their oxidative enzyme activity — changes that let you run faster at the same effort, or sustain the same pace with less.
Peak adaptation falls at Zone 4 (threshold), with Zone 3 (Tempo) close behind, and Zone 5 contributing but with diminishing returns. The mechanism: when intensity is high enough, cells burn ATP faster than they can replenish it, triggering the cellular “energy alarm” AMPK, which activates PGC-1α — the master regulator of mitochondrial biogenesis. The higher the intensity, the stronger the alarm. But push too hard and fatigue accumulates too fast to repeat frequently. Zone 4 sits at the sweet spot: signal strong enough, recoverable enough to repeat week after week.
HIIT or steady-state cardio — which is better for mitochondria? In individual studies, HIIT groups show larger increases in citrate synthase (the marker enzyme for mitochondrial oxidative capacity) — high intensity does produce a stronger signal per session. But Abrego-Guandique et al. (2025) showed that when total work volume is matched, the two approaches produce no significant difference in mitochondrial adaptation. The molecular pathway is identical; HIIT fires it with fewer, stronger pulses while steady-state cardio uses more, gentler ones — the accumulated effect is similar.
Lactate Threshold: Turning Lactate into Fuel
An improving lactate threshold means that at higher intensities, your lactate clearance rate keeps pace with production. The core mechanism is the lactate shuttle: lactate produced in fast-twitch fibers is transported through MCT1 carriers to mitochondria in oxidative fibers, where it’s burned as fuel. As training progresses, MCT1 density rises, clearance accelerates, and the accumulation threshold shifts to higher intensities. A 2024 meta-analysis by Benítez-Muñoz et al. integrating 41 studies confirmed that MCT1 upregulation occurs consistently across all aerobic training modes. The full mechanism is covered in Lactate Is Not Your Enemy.
The peak adaptation here is at Zone 4. High enough to continuously stress the lactate clearance system and drive MCT1 expression and enzyme efficiency further — while accumulating fatigue more slowly than Zone 5, allowing more frequent stimulus repetition. This is the physiological logic behind the Norwegian method: Casado et al. (2023) documented the Ingebrigtsen brothers training 3–4 times per week with threshold intervals targeting blood lactate of 2–4.5 mmol/L, precisely calibrated to maximize lactate threshold adaptation while maintaining training frequency.
Muscle Glycogen Storage: How Much Fuel You Can Carry
Peak adaptation falls at Zone 3 (Tempo) — in Coggan’s table, glycogen storage scores highest at Z3, not Z4 or Z5.
The mechanism: moderate-to-high intensity training repeatedly depletes muscle glycogen, and during resynthesis the body supercompensates — rebuilding stores above their pre-training level. GLUT4 transporter expression (which moves glucose into cells) also rises with training, raising the storage ceiling. Zone 3’s advantage comes from sitting between high depletion (enough to drain glycogen) and low fatigue (short enough recovery to repeat frequently), allowing more sessions than Zone 4 or 5. For marathon runners, this directly determines whether the second half falls apart.
Cardiopulmonary Output: The Size of the Pipes
VO2max is determined by two things: how much blood the heart pumps per minute, and how much oxygen muscles can extract from it. In Coggan’s table, both peak at Zone 5.
Helgerud et al.’s 2007 RCT confirmed this directly: 40 subjects were randomized into four groups, and after 8 weeks the Zone 5 interval group showed the largest VO2max improvements — stroke volume increases were tightly correlated with VO2max gains. Zone 2 and Zone 3 groups showed no significant improvement in either metric. Greater stroke volume per beat is the primary driver of VO2max gains, and Zone 5 produces the strongest signal for that adaptation.
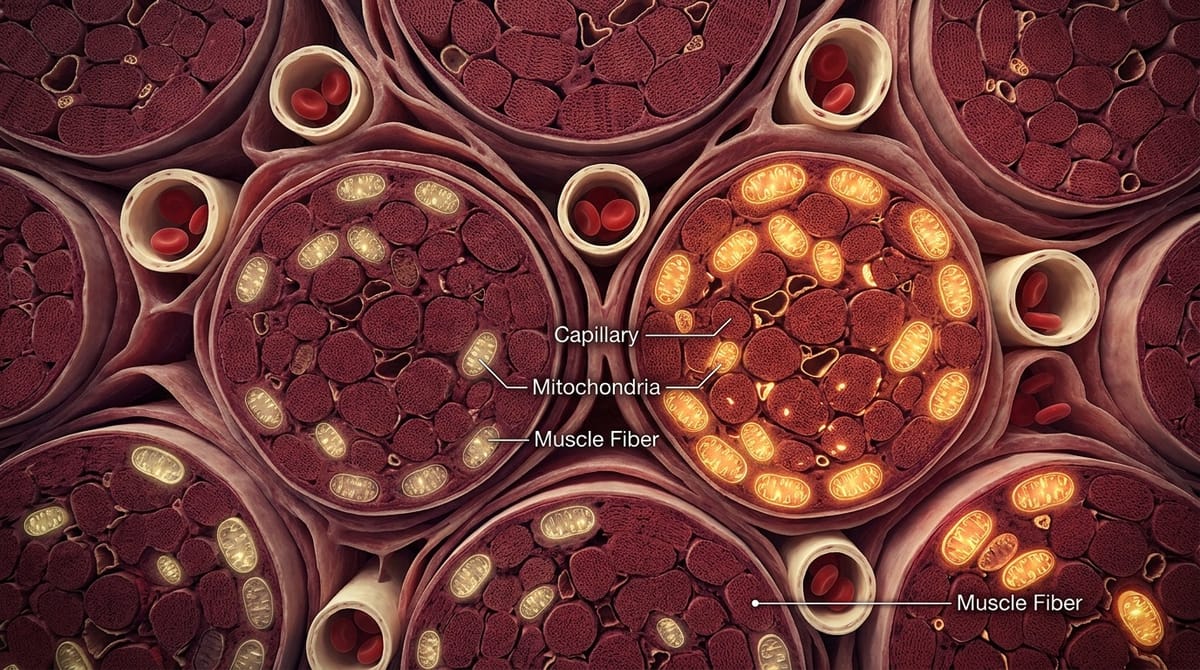
Muscle Capillaries: The Last Mile for Oxygen
Blood pumped out still has to reach the muscle fibers. Capillaries are the delivery network. With training, capillary density in muscle increases (angiogenesis), shortening the diffusion distance from blood to muscle cell and improving oxygen utilization.
In Coggan’s table, capillarization peaks at Zone 5. The key molecular signal for angiogenesis is VEGF (vascular endothelial growth factor). Wahl et al. (2014) directly compared VEGF responses between high-intensity and high-volume low-intensity training — VEGF rose significantly in the high-intensity group post-exercise, while the high-volume group showed a decrease. Higher intensity generates a stronger metabolic hypoxic signal, which upregulates VEGF and drives capillary growth. This adaptation scales with intensity — Zone 5 is most efficient, but the effect increases continuously across the range, not just above a fixed threshold.
Fiber Type Transitions: Making Fast-Twitch Fibers More Aerobic
Coggan’s table separates fiber adaptations into two distinct rows. Type IIb → IIa conversion peaks at Zone 3 (●●●), with Zone 2 and Zone 4/5 lower (●●); slow-twitch fiber hypertrophy is different — it peaks at Zone 5 (●●●), with Zone 3/4 moderate. Two seemingly similar adaptations, peak zones two steps apart. Research integrating fiber data across training modes confirms that long-distance training increases slow-twitch fiber proportion, while high-intensity training produces more Type IIa fibers — different intensities build fiber changes in different directions.
Anaerobic Capacity and Lactate Tolerance: Zone 6’s Domain
In Coggan’s table, Zone 6 — near-maximal efforts lasting roughly 30 seconds to 2 minutes — is the peak zone for anaerobic capacity and lactate tolerance (●●●). At this intensity, glycolytic rate far outpaces mitochondrial clearance, causing rapid lactate and hydrogen ion accumulation. Repeated exposure drives buffering adaptations: bicarbonate concentration in muscle and blood rises, intracellular pH drops more slowly, and the ability to sustain output under high-lactate conditions extends.
Zone 6 contributes little to the aerobic adaptations covered above — mitochondrial enzymes, lactate threshold, and VO2max each score only ● — but it’s essential for events like the 800m to 1500m, where maintaining pace under high lactate accumulation is decisive. Zone 6 doesn’t build the aerobic engine; it raises the tolerance ceiling for when that engine overheats.
Neuromuscular Power: Zone 7’s Terminal
Zone 7 — all-out sprints, typically under 10–15 seconds — peaks at neuromuscular power (●●●) in Coggan’s table, while also providing meaningful stimulus for fast-twitch fiber hypertrophy (●●) and high-energy phosphate storage (ATP-PCr, ●●).
The adaptations here run through neural pathways, not metabolic ones: motor unit recruitment increases, motor neuron firing rate accelerates, and inter-muscular coordination improves — enabling rapid mobilization of more fast-twitch fibers in an instant. The phosphocreatine (PCr) system supplies energy in the first few seconds of a sprint; Zone 7 training raises both PCr storage and resynthesis rate. For middle- and long-distance runners, Zone 7’s contribution is concentrated in finishing kick capacity, not the aerobic engine powering the race body.
The Fat-Burning Myth
“You need Zone 2 to burn fat” — this conflates two different things: the energy substrate used during exercise, and long-term metabolic capacity built through training. Fat-burning capacity comes down to mitochondrial oxidative enzyme activity, particularly β-HAD (the key enzyme in fatty acid oxidation).
Talanian et al. (2007) showed that after 2 weeks of HIIT, whole-body fat oxidation capacity increased 36% and mitochondrial enzyme β-HAD activity rose 32%. The mechanism follows the same pathway as mitochondrial biogenesis: AMPK → PGC-1α → elevated mitochondrial enzyme activity → increased fat oxidation capacity. A review co-authored by HIIT pioneer Martin Gibala concluded: “Most studies do not support Zone 2 as the optimal intensity for improving mitochondrial capacity or fat oxidation.” What determines fat-burning capacity is mitochondrial volume — not which intensity zone you’re training in.
Putting the adaptations together, the peak intensity distribution is clear:
- Zone 3 (Tempo): Muscle glycogen storage, Type IIb → IIa fiber conversion
- Zone 4 (Threshold): Mitochondrial enzyme activity, lactate threshold
- Zone 5 (VO2max zone): VO2max, cardiac output, capillary density, slow-twitch fiber hypertrophy
- Zone 6 (Near-maximal): Anaerobic capacity, lactate tolerance
- Zone 7 (All-out sprint): Neuromuscular power, ATP-PCr storage, fast-twitch fiber hypertrophy
Zone 2 contributes to every adaptation column — but it’s the peak for none of them. Its advantage is low fatigue and high repeatability: with enough volume, gentle stimuli accumulate into meaningful results. Zone 2 is a volume-building tool, not a peak-adaptation trigger.
Training Methods: Different Paths, Same Destination
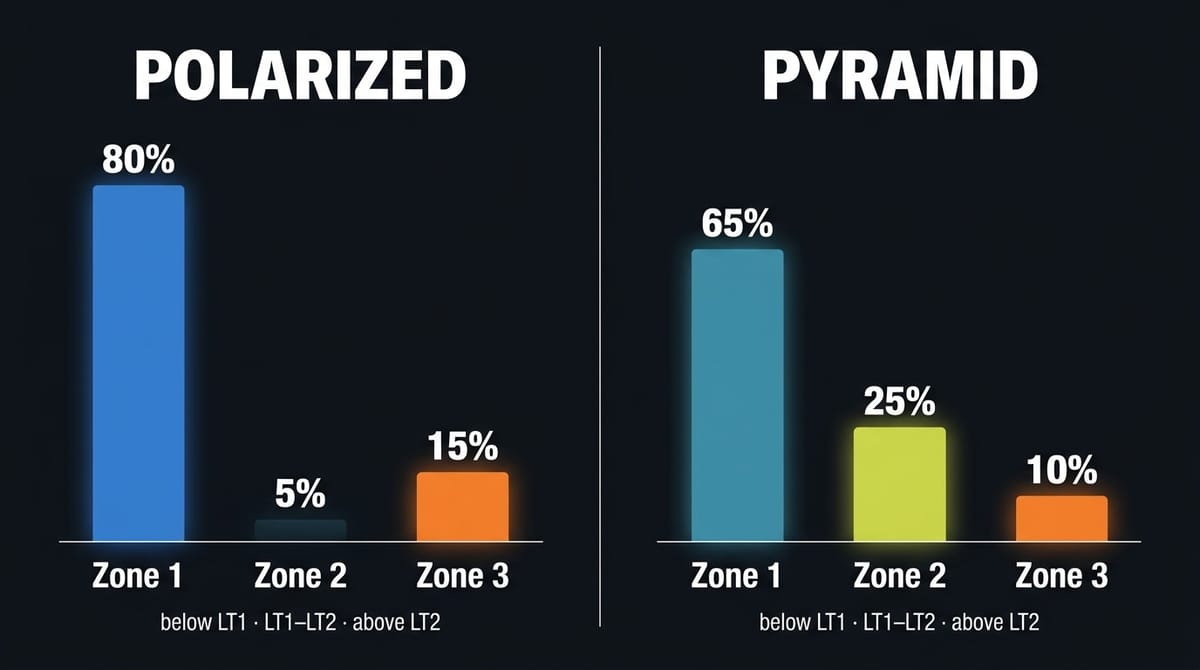
In three-zone terms: polarized training (the 80/20 framework) puts roughly 80% of time in Zone 1 (low intensity, below LT1) and roughly 20% in Zone 3 (high intensity, above LT2), with minimal time in the middle Zone 2 (tempo to threshold, LT1–LT2). Pyramid training distributes volume in decreasing amounts up the intensity ladder — a large Zone 1 aerobic base, a meaningful slice of Zone 2 threshold work, and a small Zone 3 stimulus at the top.
Which is better? A 2024 meta-analysis by Oliveira et al. integrating 17 RCTs (n=437) compared polarized against other intensity distribution models: time trial performance, time to exhaustion, LT2 speed — no significant differences. Polarized training showed a slight edge in VO2max, but only in short interventions (< 12 weeks) with high-level athletes; the advantage disappeared in longer studies.
Different training methods prioritize different physiological components: polarized targets VO2max and cardiac output, threshold training targets mitochondrial enzymes and lactate threshold, high-volume low-intensity builds fat oxidation capacity. What actually limits your performance determines which components matter — not which pathway gets you there.
Volume and Pace: Not a Trade-Off
Fokkema et al. (2020) tracked nearly a thousand runners (n=997) preparing for half- and full marathons. The finding was clear: weekly mileage and training pace each independently predicted finish time, with no overlap between their contributions. Low mileage with higher pace and high mileage with lower pace activate different proportions of physiological adaptations — but when aerobic load is sufficient, competitive level can converge.
This is why elite runners can train completely differently and still end up on the same Olympic final start line.
Every runner takes a different path. The physiology that makes you better is the same. The path doesn’t determine how fast you run — how much of it you cover does.
References
- 1. Allen, H., & Coggan, A. R. (2019). Training and racing with a power meter (3rd ed.). VeloPress. (Original work published 2006)
- 2. Benítez-Muñoz, J. A., Rubio-Arias, J. Á., Valls-Lacalle, L., González-Ponce, Á., de Vera-Floristán, C., López-Ayala, J. M., & Jiménez, S. L. (2024). Exercise influence on monocarboxylate transporter 1 (MCT1) and 4 (MCT4) in the skeletal muscle: A systematic review. Acta Physiologica, 240(1), e14083. ↗
- 3. Casado, A., Foster, C., Bakken, M., & Tjelta, L. I. (2023). Does lactate-guided threshold interval training within a high-volume low-intensity approach represent the "next step" in the evolution of distance running training? International Journal of Environmental Research and Public Health, 20(5), 3782. ↗
- 4. Helgerud, J., Høydal, K., Wang, E., Karlsen, T., Berg, P., Bjerkaas, M., Simonsen, T., Helgesen, C., Hjorth, N., Bach, R., & Hoff, J. (2007). Aerobic high-intensity intervals improve VO2max more than moderate training. Medicine & Science in Sports & Exercise, 39(4), 665–671. ↗
- 5. Wahl, P., Jansen, F., Achtzehn, S., Schmitz, T., Bloch, W., Mester, J., & Werner, N. (2014). Effects of high intensity training and high volume training on endothelial microparticles and angiogenic growth factors. PLOS ONE, 9(5), e96024. ↗
- 6. Talanian, J. L., Galloway, S. D. R., Heigenhauser, G. J. F., Bonen, A., & Spriet, L. L. (2007). Two weeks of high-intensity aerobic interval training increases the capacity for fat oxidation during exercise in women. Journal of Applied Physiology, 102(4), 1439–1447. ↗
- 7. Oliveira, P. S., Boppre, G., & Fonseca, H. (2024). Comparison of polarized versus other types of endurance training intensity distribution on athletes' endurance performance: A systematic review with meta-analysis. Sports Medicine, 54, 2817–2835. ↗
- 8. Fokkema, T., van Damme, A. A. D. N., Fornerod, M. W. J., de Vos, R.-J., Bierma-Zeinstra, S. M. A., & van Middelkoop, M. (2020). Training for a (half-)marathon: Training volume and longest endurance run related to performance and running injuries. Scandinavian Journal of Medicine & Science in Sports, 30(9), 1692–1704. ↗
- 9. Storoschuk, K. L., Moran-MacDonald, A., Gibala, M. J., & Gurd, B. J. (2025). Much ado about zone 2: A narrative review assessing the efficacy of zone 2 training for improving mitochondrial capacity and cardiorespiratory fitness in the general population. Sports Medicine, advance online. ↗
If this article was helpful, feel free to buy me a coffee ☕ and keep me writing.