After meeting more and more runners, I’ve noticed something: a lot of people know about Zone 2, know about lactate thresholds, know about polarized training. They follow the plan. They complete the workouts.
But when the body responds in unexpected ways — when recovery is unusually poor one week, when test numbers come back very different from last time — most people don’t know what to do.
Part of the reason is that these terms make training look like a problem with a right answer: find LT1 and LT2, fill your mileage into the corresponding zones. The framework gives direction, but not enough understanding to handle what falls outside it.
What LT1 / LT2 Are
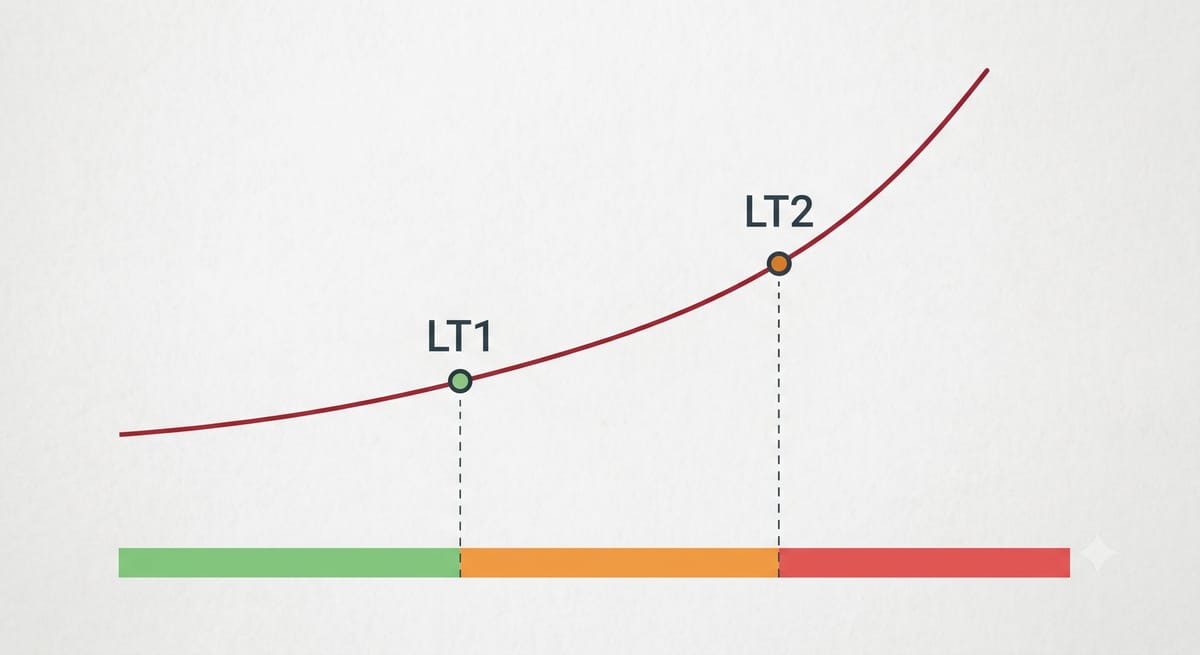
LT1 (first lactate threshold) is the exercise intensity at which blood lactate begins to rise above resting baseline. Below this point, the body primarily burns fat, lactate production is slow, and breathing is easy. Past LT1, glycolysis kicks in, blood lactate rises gradually, and intensity enters the moderate aerobic range.
LT2 (second lactate threshold) is one level higher. Above this intensity, lactate accumulates faster than the body can clear it, ventilation increases, and breathing becomes labored. This is the upper limit of threshold training intensity, and it sits close to the fastest speed that can be sustained in a time trial.
These two points form the skeleton of the three-zone model: Zone 1 below LT1, Zone 2 between LT1 and LT2, Zone 3 above LT2. The five-zone model subdivides further — splitting the range below Zone 2, and splitting what’s above Zone 3. Polarized training, threshold training — all mainstream training models operate on this same axis, differing only in how they distribute volume.
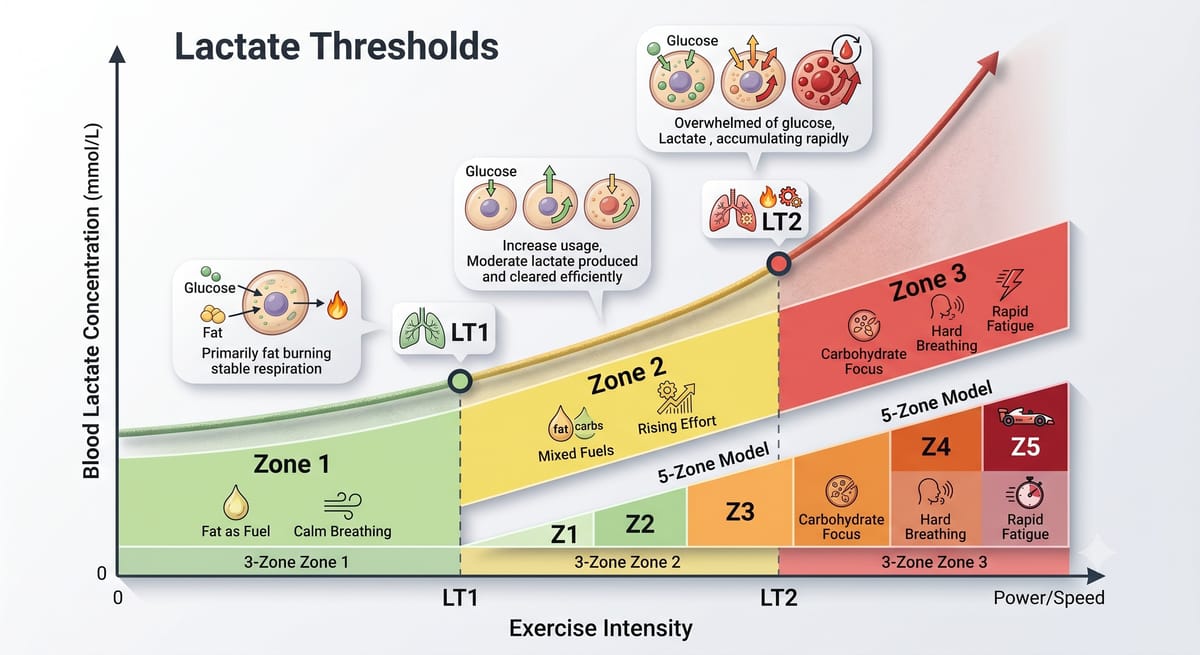
In recent years, thanks largely to Peter Attia and Iñigo San Millán, “Zone 2” has become enormously popular in mainstream training culture — but the Zone 2 they’re referring to is Zone 2 of the five-zone model: easy aerobic intensity below LT1, roughly corresponding to blood lactate staying under 2 mmol/L. In the three-zone model, this same intensity is called Zone 1. The same label “Zone 2” refers to completely different intensity ranges depending on which system you’re using. Before discussing training zones, confirming which system you’re both using matters more than debating the numbers.
The framework does have real value — it gives training a shared language, a common foundation on which coaches, athletes, and researchers can all discuss intensity.
But the term “lactate threshold” itself implies a switch — one state before you cross it, another after. Human metabolism has no such switch. Lactate is continuously produced and cleared at every exercise intensity. LT1 and LT2 are statistical description points for lactate dynamics under specific conditions, not hard physiological boundaries.
In the 1970s, a German sports medicine research group in Cologne systematically developed lactate testing methods and established 4 mmol/L as the benchmark for anaerobic threshold. That number was a meaningful population average at the time — but it has since been widely applied to individual training, well beyond the scope it was originally designed for.
The Reality of Measuring LT1 / LT2
Finding “your own” LT1 and LT2 is far more complicated than the numbers suggest.
There are currently more than ten methods for determining lactate threshold: visual inspection, D-max, fixed concentration (using 2 mmol/L for LT1 and 4 mmol/L for LT2), ventilatory threshold (VT1/VT2), individual anaerobic threshold (IAT). All of them are in use. None of them give exactly the same results.
How large is the gap between methods? Take D-max — a method that defines the threshold by finding the point of maximum geometric distance on the lactate curve — it ranks last for reliability in published research, with a coefficient of variation reaching 10.3%. That means the same person tested at different times can see results shift by more than 10%. The fixed concentration method has a coefficient of variation of 3–4%, relatively more stable, but only if that fixed value actually has physiological meaning for you.
The bigger problem is that 2 mmol/L and 4 mmol/L are population statistics, not individual physiological truths. One study had subjects run steadily at their own individually determined lactate threshold pace, then measured actual blood lactate — results ranged from 1.90 to 3.80 mmol/L. Everyone was running at “their threshold pace,” but the actual physiological states varied considerably. This means the concept of threshold pace does not point to a consistent physiological state across different people.
LT2 and maximal lactate steady state (MLSS) are often used interchangeably in practice, but most research shows MLSS corresponds to a slightly lower intensity than LT2. The two point in the same direction, but they’re not the same point. If your training is based on LT2, you may be running above MLSS for extended periods without realizing it.
Pre-test conditions are a major factor in results, and one that’s typically underestimated. Muscle glycogen is the primary substrate for blood lactate. Carbohydrate intake in the days before testing, training load, and sleep quality all change the shape of the lactate curve. With depleted glycogen, the entire curve shifts systematically, making the measured threshold intensity appear higher than it actually is. Residual high-intensity fatigue within 48 hours of the test similarly distorts readings.
Differences in sampling site (earlobe vs. fingertip) and reduced peripheral blood flow in cold environments — each detail adds more uncertainty to the measurement. Portable blood lactate analyzers tend to show systematic error at values above 6 mmol/L. Smartwatch algorithms for estimating lactate threshold perform reasonably well for people near the population average, but errors amplify considerably at the extremes — athletes who are very highly trained or very untrained.
For most recreational runners, lactate threshold heart rate (LTHR) estimated from a 30-minute time trial is a more practical field option. Three Heart Rate Zone Methods compares HRmax, Heart Rate Reserve, and LTHR as anchor points.
Training Models: No Clear Winner
Suppose you’ve completed a rigorous test and have relatively reliable LT1 and LT2 values. The next question: which training model produces the best results?
A 2024 systematic review that pooled multiple randomized controlled trials compared polarized training, threshold training, and pyramidal training in recreational athletes — and found no significant difference between the three.
A 2018 meta-analysis did find a moderate advantage for polarized training on time trial performance, but that advantage appeared primarily in studies with interventions shorter than twelve weeks. When the intervention extended beyond twelve weeks, the VO₂max improvements from polarized training converged with those of other models. Short-term data supports polarized training; long-term data has no clear winner.
The relative advantage of polarized training in existing research shows up mainly among elite and world-class athletes — people whose aerobic base is already so strong that more precise intensity distribution is needed to continue driving adaptation. For recreational runners, execution consistency predicts training outcomes better than model selection.
A 2025 review stated directly: each training intensity distribution model has contexts where it applies best; the most effective approach is to adjust dynamically based on training phase and individual needs, rather than committing rigidly to any single framework.
For most recreational runners, debating “polarized vs. threshold” is energy spent in the wrong place.
Training Is an Art
Many runners keep highly detailed training logs — every run tagged with a zone, heart rate data fully analyzed. Following a plan is fine, and many people genuinely do improve doing it.
The problems usually appear outside the framework — when the plan and the body’s state don’t match, when test results come back unexpected, when training stalls and it’s unclear where to adjust. If your understanding of zone models stops at “fill in the numbers,” you’ll have very little room to maneuver when these situations arise.
Research shows that training plans dynamically adjusted based on individual recovery status and training state outperform any fixed plan set in advance. Two recreational runners with the same LT1/LT2 values but different training ages — say, one year versus five — need different types of stimulus, recover at different rates, and have different intensity tolerance. Even if their threshold numbers are identical, the appropriate training plan is not.
Newer runners have the most room to grow from neural adaptation and movement efficiency. At this stage, almost any training produces results; threshold precision matters relatively little, and volume alone is enough to drive adaptation. More experienced runners have saturated their neural adaptation ceiling and need more precise intensity design to continue pushing adaptation — their tolerance for measurement error is correspondingly lower.
These two situations call for fundamentally different training prescriptions. But zone models don’t tell you which category you’re in.
Translating all these factors into an actual training plan involves judgment calls: current training history, past injury record, this week’s stress and sleep, how far out the season target is. None of that can be replaced by a test result.
LT1 and LT2 are useful maps. They describe how the body operates at different intensities and give a shared language for discussion. But the map is not the terrain.
The hard part starts after you have the number.
References
- 1. Faude, O., Kindermann, W., & Meyer, T. (2009). Lactate threshold concepts: How valid are they? Sports Medicine, 39(6), 469–490. ↗
- 2. Urhausen, A., et al. (2022). Lactate thresholds and the simulation of human energy metabolism. Frontiers in Physiology, 13, 899670. ↗
- 3. Gronwald, T., et al. (2023). From incremental test to continuous running at fixed lactate thresholds: Individual lactate responses. PLOS ONE. ↗
- 4. Layne, A. S., et al. (2025). Accuracy of fixed intensity anchors to estimate lactate thresholds in recreational runners. PLOS ONE. ↗
- 5. Mujika, I., et al. (2026). Validity and reliability of portable blood lactate analyzers: Systematic review. Sports Medicine – Open. ↗
- 6. Boullosa, D., et al. (2025). Accuracy of wearables for determining VO₂max and lactate threshold. Frontiers in Sports and Active Living. ↗
- 7. Stöggl, T. L., & Sperlich, B. (2018). Polarized versus threshold training intensity distribution. Frontiers in Physiology. ↗
- 8. Rosenblat, M. A., et al. (2024). Comparison of polarized versus other types of endurance training in recreational to elite athletes: Meta-analysis. Journal of Strength and Conditioning Research. ↗
- 9. Casado, A., et al. (2025). Recent advances in training intensity distribution theory for cyclic endurance sports. Frontiers in Physiology. ↗
- 10. Vesterinen, V., et al. (2022). Individualized endurance training based on recovery and training status in recreational runners. International Journal of Sports Physiology and Performance, 17(12), 1776–1783. ↗
If this article was helpful, feel free to buy me a coffee ☕ and keep me writing.