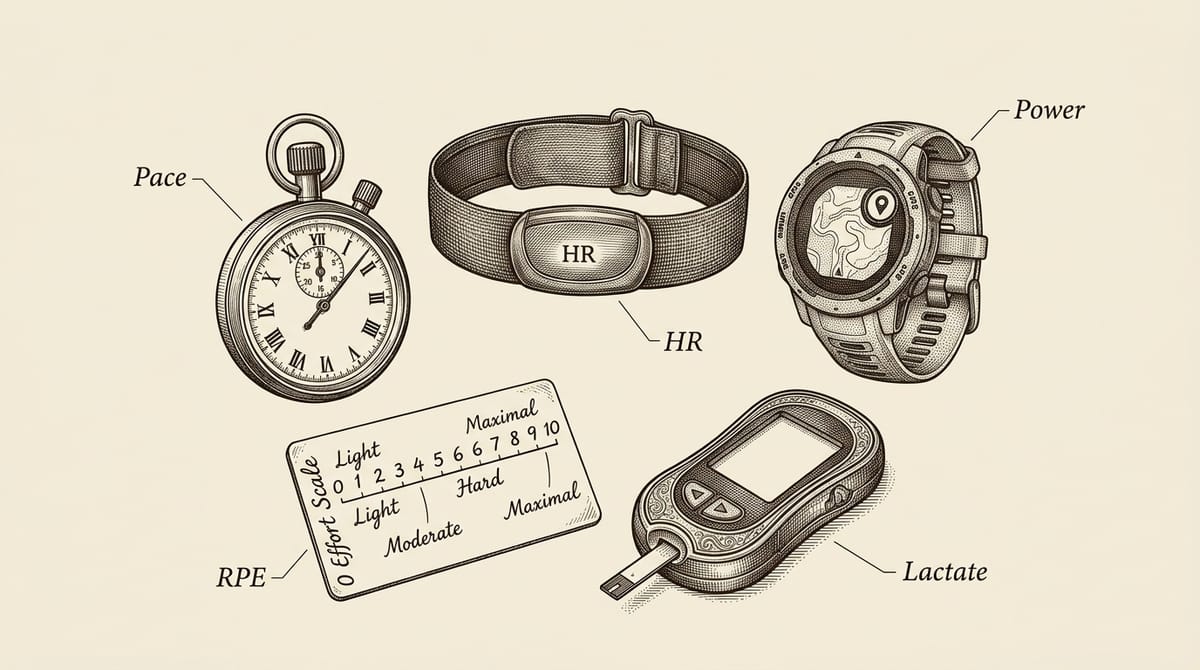
Most runners have used at least two monitoring tools: heart rate, pace, power, or RPE (Rate of Perceived Exertion).
Many assume they measure different things. In reality, they all answer the same question:
Is my training intensity right now actually landing in the target zone?
The difference is that each tool estimates this from a different angle.
Heart rate reflects the body’s internal response. Pace represents external performance. Power represents mechanical output. Blood lactate directly describes metabolic stress. RPE integrates everything the body is feeling.
No single metric can fully describe training intensity. What actually matters is understanding what each one represents — and when each one lies.
RPE: The Calibration Layer Above Data
RPE is not a fallback for when you have no devices. It’s the calibration tool for all objective data.
Within a matter of minutes, the brain integrates neuromuscular recruitment, respiratory load, sleep quality, accumulated fatigue, and immune status into a composite signal that no sensor can directly measure.
The value isn’t RPE itself — it’s whether RPE aligns with the data.
The same pace feeling unexpectedly hard might indicate fatigue, dehydration, or insufficient recovery. An abnormally high heart rate with a normal perceived effort might just be cardiovascular drift caused by heat. RPE can’t tell you where the fatigue is coming from, but it can tell you today’s body is different from usual.
Heart Rate: Reliable — But Not Always
Heart rate is the most widely used physiological monitoring tool among runners, and the earliest to be systematically applied in the history of endurance training. Continuous, non-invasive, real-time. During steady-state aerobic training, it reliably reflects the body’s internal load — which is why it has remained central to training for decades.
It has two reliable long-term applications: tracking submaximal exercise heart rate (HRex) at the same pace to gauge aerobic adaptation, and using resting HRV (the variation in beat-to-beat intervals, an indirect marker of autonomic recovery) to detect acute fatigue. Both work well in low-intensity steady-state aerobic training.
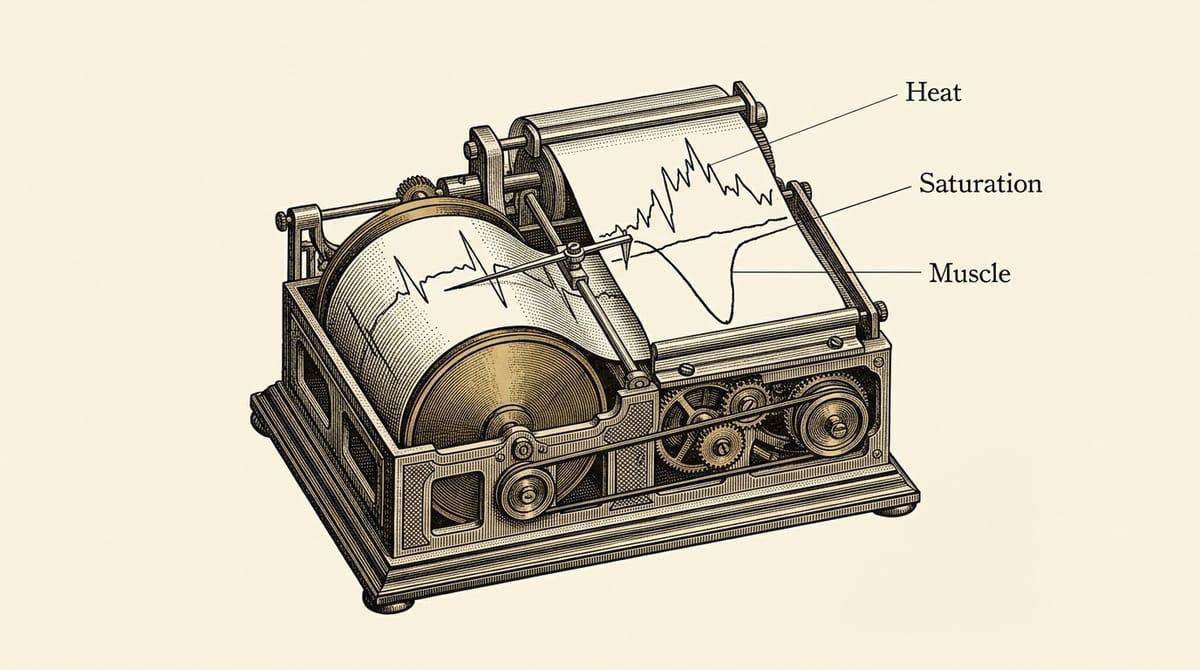
But heart rate gives false information in three scenarios.
Heat and Heat Acclimatization
The heart is simultaneously managing thermoregulation and oxygen delivery, driving heart rate up. More counterintuitively, once heat acclimatization is complete, plasma volume increases — and HRV may paradoxically rise even when the athlete is more fatigued and pace is declining. Buchheit tracked athletes through a desert ultramarathon: after day four, HRV values looked “well-recovered,” but pace and subjective fatigue continued to deteriorate. Relying on HRV alone would lead to completely wrong decisions.[1]
Saturation Effect During High Training Volume
In elite athletes during high-volume phases, vagal tone is extremely high, and HRV markers may actually drop due to receptor saturation. That decline doesn’t signal fatigue — it signals that the heart has highly adapted. But almost everyone reads it as “poor condition” and mistakenly reduces training load.
Neuromuscular Fatigue and Glycogen
Neuromuscular fatigue (the repair stress following muscle damage) and glycogen (stored muscle energy) both directly affect running performance, but heart rate has no awareness of either. Post-race leg soreness and serious muscle damage can coexist with completely normal HRV. Running on depleted glycogen gives no warning signal in heart rate either.
There’s also a structural problem: heart rate lags behind intensity changes by 30–60 seconds. A 30-second hill sprint ends, and heart rate only peaks afterward. The number you’re reading no longer represents the intensity you just ran.
Pace: Measures Outcome, Not Stress
Pace tells you how fast you covered the distance, given your current environment and body state. It’s the outcome — not the metabolic stress itself. The same 5:00/km pace on a cool, flat spring road and a hot afternoon climb represent completely different intensities for the body.
On flat, constant-grade terrain, the correlation between pace and power reaches R²=0.97.[2] With minimal wind and consistent grade, watching pace and watching power are nearly equivalent — which is why pace suffices in flat conditions.
But once grade, headwind, heat, or altitude enters the picture, that equivalence breaks down. Maintaining pace on a climb might push metabolic stress into threshold territory, while pace just shows “slightly slower.” In the second half of a marathon, many runners fade — often not because of pacing strategy errors, but because surface pace in the first half gave the impression of controlled intensity while heart rate and lactate had already crept too high.
Pace is most reliable for flat race simulations (confirming that target finish speed is executable) and recovery run intensity confirmation (ensuring effort stays below threshold). In both cases, environmental variables are minimal, and pace is a trustworthy approximation of power.
Power: The Closest Tool to Real-Time Intensity in Racing
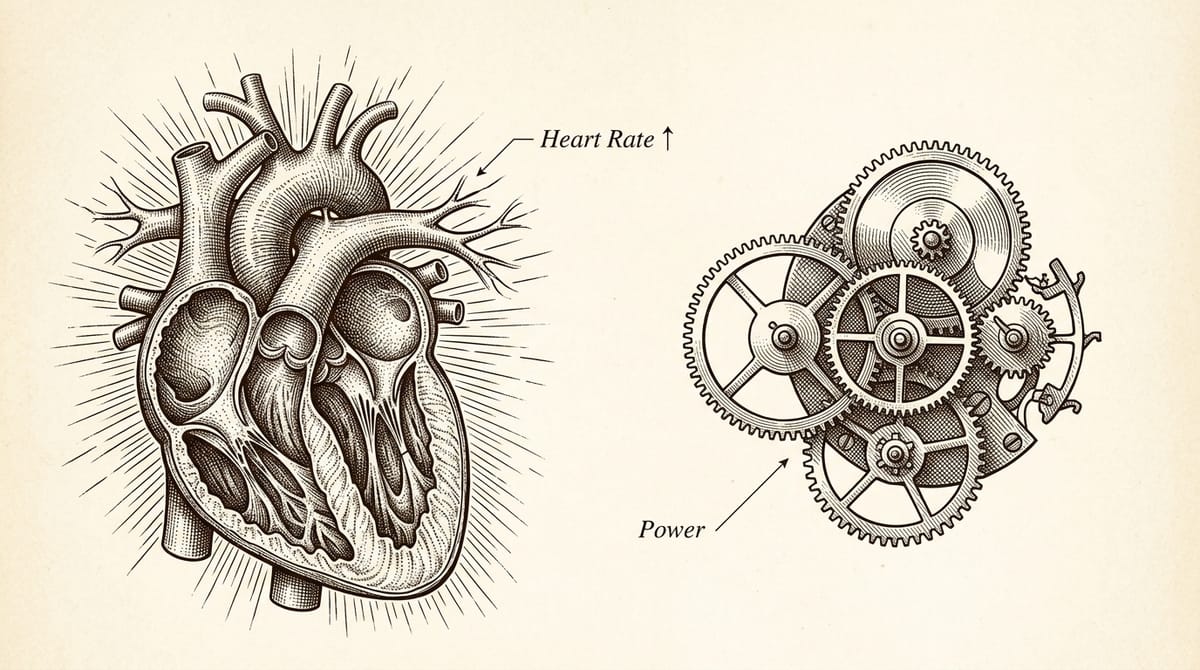
Power bypasses heart rate’s lag, pace’s terrain dependency, and RPE’s subjectivity. It is currently the most objective real-time monitoring tool for training intensity.
Power’s core advantage is its immediate reflection of the mechanical output an individual applies to the ground. It eliminates the 30–60 second lag of the cardiovascular system and is unaffected by terrain grade. In practice, algorithms like Stryd have built grade compensation into their calculations — the moment a runner begins climbing, power immediately captures the additional metabolic burden, and drops back instantly at the crest.
This real-time objectivity matters most during long-distance racing. Heart rate during a race typically follows a characteristic physiological trajectory: low at the start (sympathetic lag), rising to a stable value, then continuing to climb in the second half due to hyperthermia and dehydration-driven cardiovascular drift. Pacing by heart rate zone at this point will force the runner to slow down — even when the heart rate rise is largely unrelated to actual physical output intensity.
Power, by contrast, demonstrates extremely high physiological stability and repeatability. Van Rassel’s research found that during 30 minutes of exercise at MLSS (maximum lactate steady state) intensity, power deviation was just 0.1%, while VO₂ drifted +50 mL/min under the same conditions. Tests repeated days apart showed an intraclass correlation coefficient (ICC) of 1.00 for power.[3]
This means that once a target power is established through threshold testing, maintaining that output on race day lets pace self-optimize for wind and grade — eliminating the miscalculations of chasing pace or being misled by second-half cardiac drift.
Blood Lactate: Building Your Physiological Map
The previous four tools share the same problem: they estimate intensity. The estimation is indirect. Blood lactate is not.
Draw a drop of blood at a given pace, and you know directly whether the metabolic stress that pace is imposing on your body is high or low — whether you’re approaching a critical threshold. No lag, no environmental noise, no subjective component.
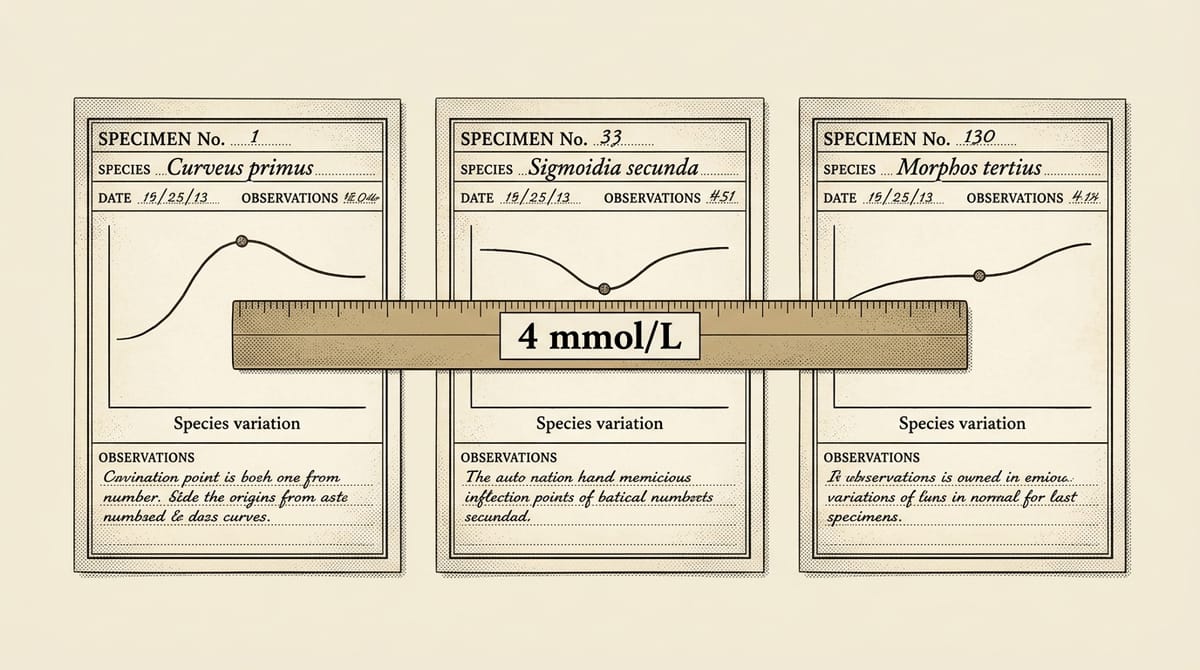
The core value of lactate monitoring isn’t pinpointing a single 4 mmol/L threshold. It’s using samples across multiple pace points to map out your personal lactate curve. Once you know your lactate concentration at each pace, you have a map that precisely links speed to metabolic stress — making daily training intensity execution something measurable rather than guessed.
The 4 mmol/L universal threshold is an oversimplification: untrained individuals may fall at 2–3 mmol/L; elite aerobic athletes can sustain 7–8 mmol/L. Of the 25 threshold definitions in the literature, MLSS correlates most strongly with performance,[4] but testing it is cumbersome. A complete personal lactate curve makes the debate over which number to use irrelevant — you already have the full picture.
Blood lactate is also the most direct scientific evidence for tracking training adaptation. The same pace showing significantly lower lactate several months later is concrete proof of improved aerobic capacity — more convincing than HRV estimates or VO₂max calculations.
Though the cost of equipment and trained administration limits daily use, it works well as a once- or twice-yearly baseline test: build the curve, calibrate your training zones, then use more convenient tools for daily tracking. That combination delivers both precision and practicality.
The Dimensions of Data, the Gradations of Feel
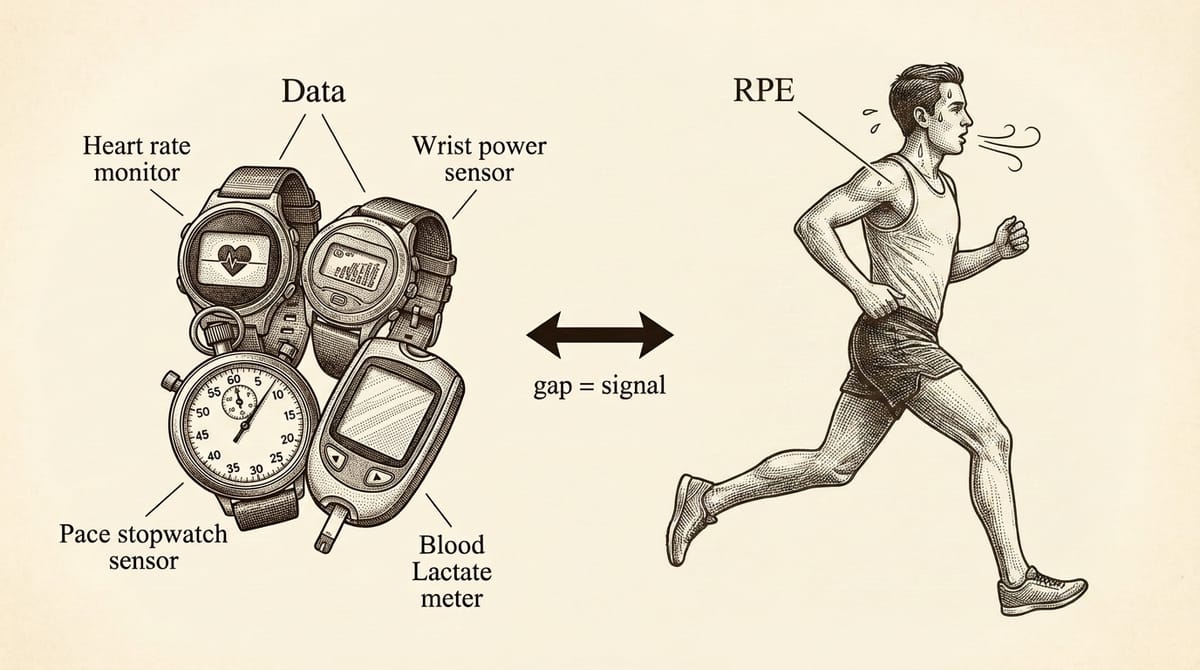
These five monitoring tools aren’t competing alternatives. They’re a layered, complementary system — each providing a different resolution of the same physiological reality.
Within this system, RPE is the irreplaceable foundation.
RPE is the composite output of the central nervous system, metabolic state, sleep quality, and recovery status — no objective metric can be interpreted without it. The core skill of advanced training monitoring is the ability to detect the gap between perceived effort and data: when power or pace diverges from RPE, the gap itself is a physiological signal. It may foreshadow hidden fatigue, heat stress, or immune disruption. Data provides coordinates; body sense provides context. Neither is sufficient alone.
Building this map takes long-term accumulation — the same principle as lactate testing: establishing a reference between physiological stress and objective output. The difference is only in resolution.
In the high-stakes environment of racing, this map is worth the most. When the first half triggers an adrenaline-fueled sense of effortless momentum, only runners who have deeply internalized this map can make rational intensity decisions at the critical junctures.
Within the overall training architecture: heart rate tracks long-term aerobic adaptation; pace translates to intuitive execution language on flat terrain; power locks in real-time output for threshold training and racing; blood lactate calibrates all zones in one or two annual baseline tests. And RPE runs in the background throughout — continuously checking whether feel and numbers are aligned.
Blind faith in data turns you into a slave to the instruments. It’s only by staying alert to the gap between metrics and sensation that this physiological map gains a soul.
References
- 1. Buchheit M. Monitoring training status with HR measures: do all roads lead to Rome? Front Physiol. 2014;5:73. ↗
- 2. Aubry RL, Power GA, Burr JF. An assessment of running power as a training metric for elite and recreational runners. J Strength Cond Res. 2018;32(8):2258–2264. ↗
- 3. van Rassel CR, Sales KM, Macpherson REK, et al. Running power is more sustainable than heart rate for monitoring long duration exercise intensity. Front Physiol. 2021;12:682333. ↗
- 4. Faude O, Kindermann W, Meyer T. Lactate threshold concepts: how valid are they? Sports Med. 2009;39(6):469–490. ↗
If this article was helpful, feel free to buy me a coffee ☕ and keep me writing.