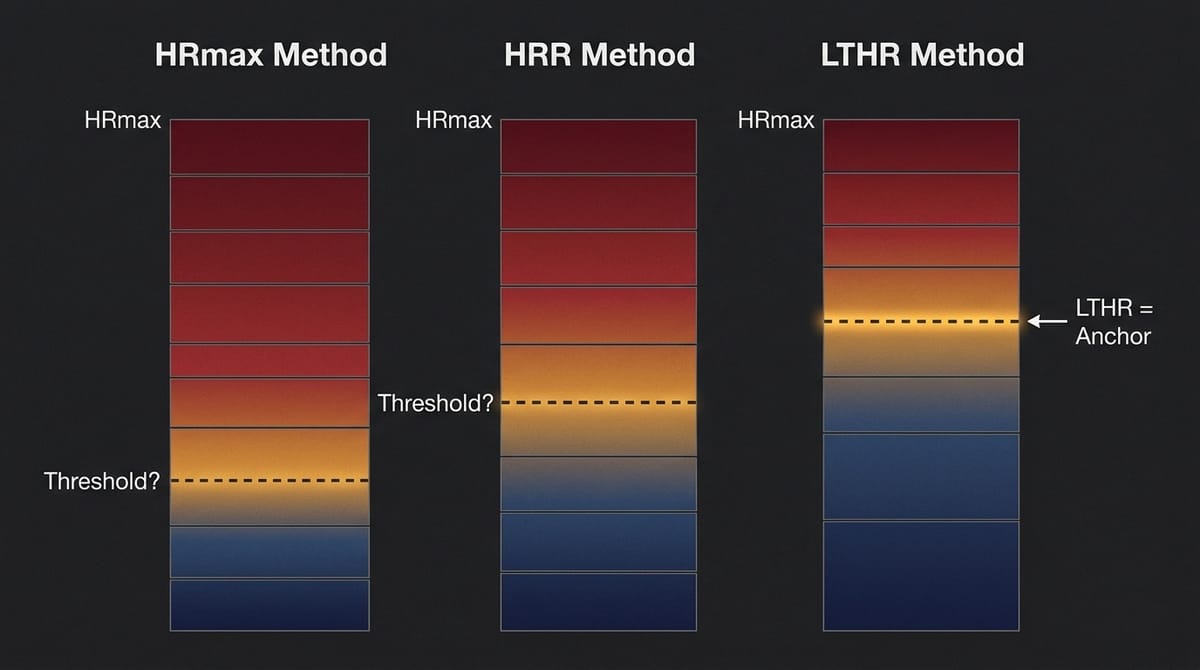
Many runners use heart rate to track training intensity — but before the numbers mean anything, you need to set your zones.
Set them wrong, and every reading that follows will be off.
The question isn’t how to divide your zones. It’s what you use as the anchor point.
That anchor determines whether the numbers actually reflect your physiology.
HRmax Method: High Cost, One Static Number
The HRmax method is straightforward: find your maximum heart rate, then carve out training zones using fixed percentages.
| Zone | Heart Rate Range | Intensity |
|---|---|---|
| Zone 1 | 50–60% HRmax | Very easy recovery activity |
| Zone 2 | 60–70% HRmax | Easy aerobic running |
| Zone 3 | 70–80% HRmax | Moderate-intensity tempo |
| Zone 4 | 80–90% HRmax | High-intensity threshold |
| Zone 5 | 90–100% HRmax | VO2max training to anaerobic |
If you skip the age formula and go for an actual measurement, the first step is finding your HRmax.
A common field test protocol:
- Easy 10-minute warm-up
- Run one mile (~1600m) at 10K race pace
- Don’t stop — increase pace every minute
- Accelerate by roughly 20 sec/km each time
- Continue until you can no longer hold the pace
- Record the highest heart rate you see
The whole thing takes about 25–30 minutes.
The design logic: use the tempo portion to bring heart rate well up, then use the progressive acceleration to push it toward its ceiling. Compared to a flat-out sprint, this approach tends to get closer to true HRmax.
But reaching true HRmax is harder than most people expect.
The highest number you see at the end of the test is technically HRpeak — it doesn’t necessarily equal your physiological ceiling.
Research shows that approaching true HRmax requires subjects to keep pushing at near-exhaustion, not just heavy breathing.
Most people stop before that point. Breathing has gone out of control, legs have started slowing, or the psychological willingness to keep hurting has run out.
The test ends. But true HRmax was never actually reached.
For experienced runners, this is already a brutal test. For beginners, add safety and physical load to the concerns.
Even if you nail an accurate HRmax, it still can’t answer the more important question:
Where is your threshold?
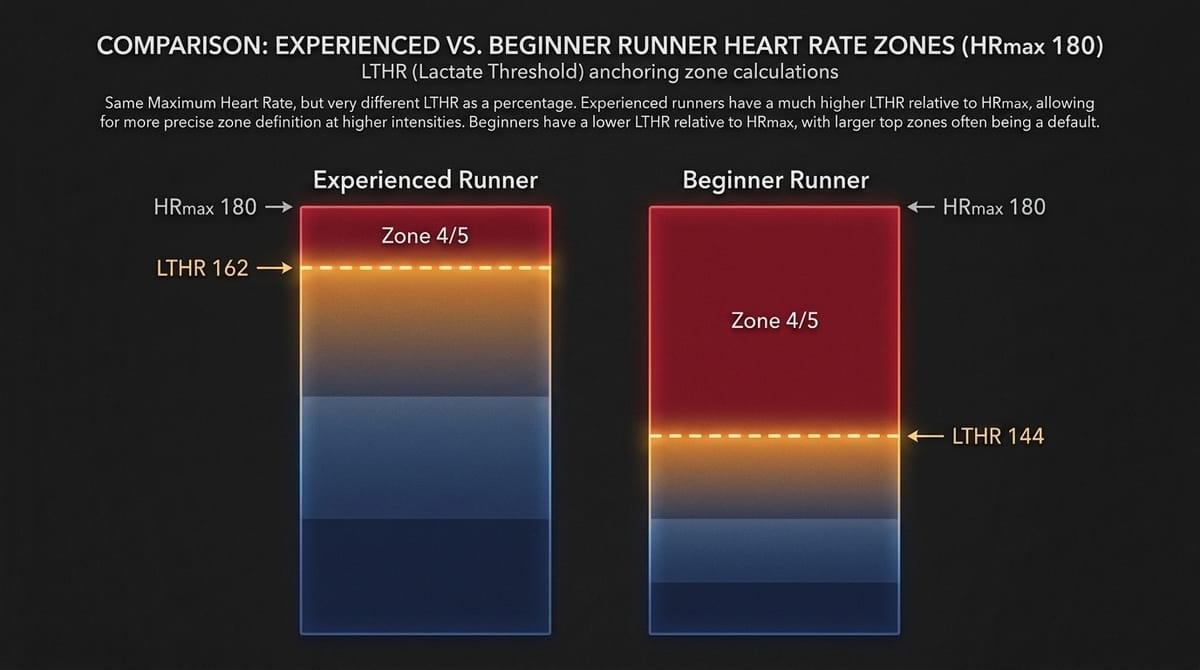
The HRmax method assumes everyone’s threshold sits at a similar percentage of their maximum. Reality doesn’t work that way.
A well-trained runner’s LTHR might sit at 90% of HRmax. Someone just starting out might only hit their threshold at 80%.
Two people, same HRmax of 180 bpm, completely different ability to sustain high-intensity effort.
Apply the same “Zone 4 = 80–90% HRmax” definition to both, and one person is running comfortably below threshold while the other has blown past it and is accumulating fatigue fast.
Same numbers. Completely different physiology.
There’s another problem: HRmax barely changes with training.
It’s closer to a genetically determined ceiling than a training adaptation.
What does change with training is submaximal capacity.
Same heart rate, faster pace. Same pace, lower heart rate. Lactate threshold appearing at higher intensity.
These are the real markers of endurance improvement.
But a zone system anchored to HRmax can’t capture any of this.
Six months into training, your aerobic capacity might have improved significantly — yet Zone 2’s upper boundary sits exactly where it always did.
The zones didn’t change. That doesn’t mean your fitness didn’t.
The anchor point just can’t see it.
Heart Rate Reserve: A Step Forward, But the Core Problem Stays
Heart Rate Reserve (HRR) was introduced by Finnish physiologist Martti Karvonen in 1957.
The formula:
Target HR = Resting HR + X% × (HRmax − Resting HR)
Compared to a straight HRmax percentage, this method introduces one more variable: resting heart rate.
The logic: your heart isn’t starting from zero — it’s already beating at rest. Factoring in that baseline brings the calculated training intensity closer to your actual metabolic load.
Two people with the same HRmax but different resting heart rates will get different target HRs from HRR. A fitter person with a lower resting HR will actually calculate a lower target HR — which is physiologically appropriate. Compared to everyone using the same HRmax percentage, HRR at least acknowledges that difference exists.
But the Karvonen method carries two fundamental limitations.
First: HRmax is still the upper anchor for the entire system.
The (HRmax − Resting HR) span sets the whole calculation range.
If HRmax is off by 10–15 bpm, that error propagates fully into every zone.
Resting HR adds personalization, but it doesn’t fix a bad upper anchor.
HRR makes zones more individual. It doesn’t solve the problem of HRmax being inaccurate.
Second: resting heart rate is a highly sensitive measurement.
Poor sleep, psychological stress, caffeine, recovery status, mild illness, even yesterday’s training load — all of these can shift resting HR meaningfully.
You test at 45 bpm on a fully recovered morning. The following week, stress at work pushes it to 55 bpm.
Your calculated zones shift. Your lactate threshold didn’t.
Sometimes zone drift reflects life stress, not athletic capacity.
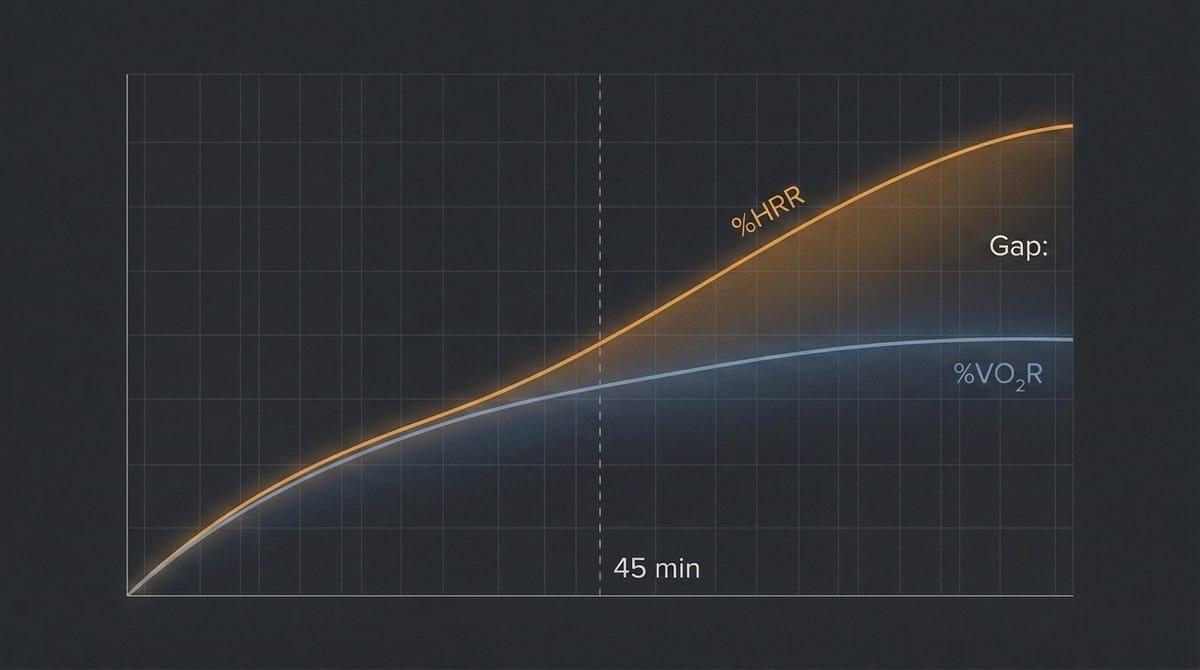
HRR also carries a hidden assumption: that your percentage of heart rate reserve maps to your percentage of oxygen uptake.
For shorter efforts, this holds. But research found that at 45 minutes, heart rate climbs roughly 7% above what the oxygen uptake intensity would predict — and the gap keeps widening (Ferri Marini et al., 2022). Most endurance runners train well past 45 minutes. The method isn’t wrong — it just has conditions.
LTHR: Anchor Directly to the Threshold
Lactate Threshold Heart Rate (LTHR) uses different logic than the other two methods.
HRmax and HRR both start from a maximum value, then try to estimate where the threshold might be.
LTHR anchors directly to the threshold itself.
It’s not interested in your physiological ceiling. It’s focused on the highest intensity you can sustain for a prolonged effort — the heart rate near LT2.
That’s one of the most important physiological turning points in endurance training and racing.
The most common field test is Joe Friel’s 30-minute time trial (Friel, n.d.).
Protocol:
- Find a flat route
- Complete the test entirely alone
- Run all-out for 30 minutes
- Press the lap button at 10 minutes
- Use the average heart rate for the final 20 minutes as LTHR
This requires a high level of effort, but not a full sprint to exhaustion.
It’s closer to a short time trial than a maximal effort.
McGehee, Tanner, and Houmard (2005) compared four field testing methods against lab lactate measurements.
The 30-minute time trial produced estimates closest to lab results — the best of the four methods tested.
That’s a key reason it’s still widely used today.
Joe Friel’s seven-zone system (Friel, n.d.):
| Zone | Heart Rate Range |
|---|---|
| Zone 1 | < 85% LTHR |
| Zone 2 | 85–89% LTHR |
| Zone 3 | 90–94% LTHR |
| Zone 4 | 95–99% LTHR |
| Zone 5a | 100–102% LTHR |
| Zone 5b | 103–106% LTHR |
| Zone 5c | > 106% LTHR |
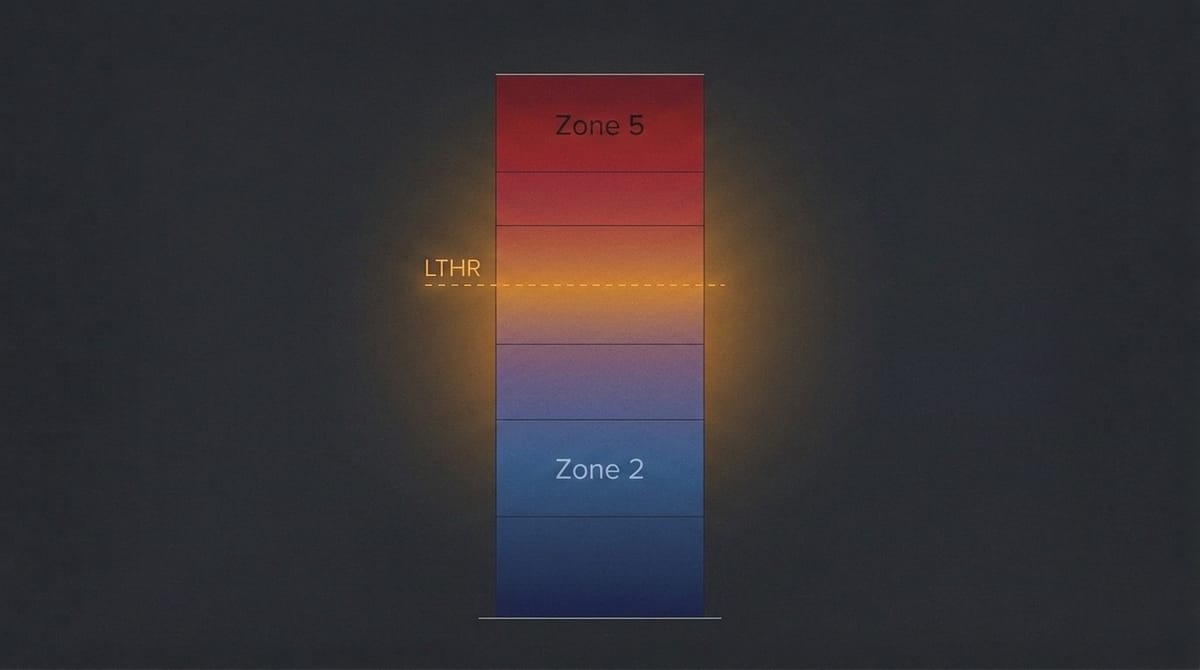
Most endurance training intensity clusters in the 85–102% LTHR range.
Easy runs, marathon pace, half-marathon pace, threshold work — nearly all of it falls here.
LTHR lives closer to where training actually happens than HRmax does.
For the physiology behind what each zone actually triggers, see Train with a Purpose.
Why LTHR Works Better as an Anchor
The fundamental difference between HRmax and LTHR is what the anchor point means physiologically.
Two runners, both with an HRmax of 180 bpm.
One has trained for ten years, LTHR at 162 bpm. The other just started running, LTHR at 144 bpm.
Under the HRmax method, their zones come out nearly identical.
But their physiological response to the same heart rate is completely different.
The problem isn’t the formula. It’s the anchor.
LTHR’s other major advantage: it moves with your fitness.
When your lactate threshold improves, the next test reflects it.
Your zone system stays current with your actual capacity, rather than freezing in place.
This is why Joe Friel recommends retesting every 4–6 weeks.
Retesting isn’t a flaw. It’s the whole point — the metric responds to training adaptation.
LTHR’s Limitations
LTHR isn’t perfect.
The 30-minute time trial gives you an estimate, not a precise measurement. McGehee et al. (2005) showed it’s the closest field method to lab results — but “closest” isn’t “identical.” Use it as a tool for tracking training status, not as a precise physiological value.
The test also demands running experience. Pacing judgment, intensity control, maintaining output without competition — all of these affect results. Most runners get unstable numbers the first time. Accuracy usually improves after a few tests.
There’s another easy-to-miss limitation: late-training progress doesn’t always show up in heart rate. Fitness gains often appear as running faster at the same heart rate, not a higher heart rate itself. Track LTHR alongside pace — numbers alone can understate how much you’ve improved.
No field test fully replicates a lab. But among the three common methods, LTHR’s anchor is closest to where training actually lives, and most responsive to the fitness changes that training produces.
The purpose of heart rate zones isn’t to categorize numbers. It’s to describe what’s actually happening in your body right now.
An anchor that moves with your fitness is worth more than one that stays fixed.
References
- 1. Ferri Marini, C., Federici, A., Skinner, J. S., Piccoli, G., Stocchi, V., Zoffoli, L., Correale, L., Dell'Anna, S., Naldini, C. A., Vandoni, M., & Lucertini, F. (2022). Effect of steady-state aerobic exercise intensity and duration on the relationship between reserves of heart rate and oxygen uptake. PeerJ, 10, e13190. ↗
- 2. Friel, J. (n.d.). Joe Friel's quick guide to setting zones. TrainingPeaks. ↗
- 3. Kasiak, P. S., Wiecha, S., Cieśliński, I., Takken, T., Lach, J., Lewandowski, M., Barylski, M., Mamcarz, A., & Śliż, D. (2023). Validity of the maximal heart rate prediction models among runners and cyclists. Journal of Clinical Medicine, 12(8), 2884. ↗
- 4. McGehee, J. C., Tanner, C. J., & Houmard, J. A. (2005). A comparison of methods for estimating the lactate threshold. Journal of Strength and Conditioning Research, 19(3), 553–558. ↗
- 5. Shookster, D., Lindsey, B., Cortes, N., & Martin, J. R. (2020). Accuracy of commonly used age-predicted maximal heart rate equations. International Journal of Exercise Science, 13(7), 1242–1250. ↗
If this article was helpful, feel free to buy me a coffee ☕ and keep me writing.